Why does epidemiology show a benefitial role of PUFAs?
-
I assume the Ray Peat community or even Peat himself has a perfectly rational explanation for why PUFAs, including linoleic acid, appear to be protective against death and a multitude of diseases in epidemiology.
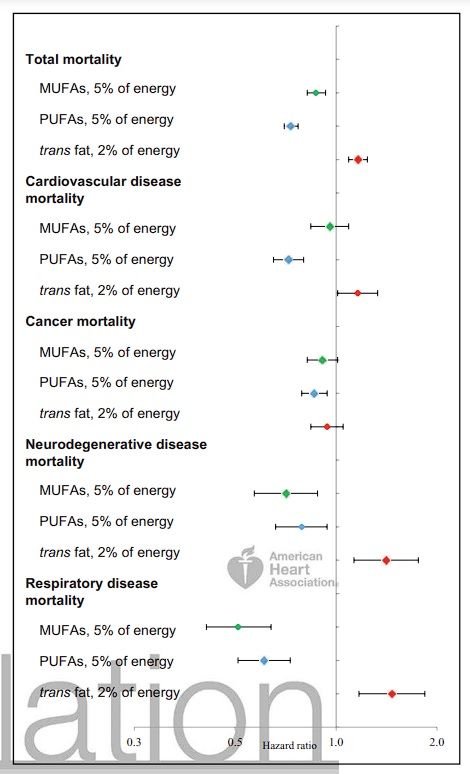
* Dietary Fats and Cardiovascular Disease: A Presidential Advisory From the American Heart Association (2017):
Total and cause-specific mortality. Hazard ratio (95% confidence interval) for substituting energy from saturated fat by the same energy from specific types of fat. Nurses’ Health Study and Health Professionals Follow-up Study.

* Association of Specific Dietary Fats With Total and Cause-Specific Mortality (2016):
During 3 439 954 person-years of follow-up, 33 304 deaths were documented. After adjustment for known and suspected risk factors, dietary total fat compared with total carbohydrates was inversely associated with total mortality (hazard ratio [HR] comparing extreme quintiles, 0.84; 95% CI, 0.81-0.88; P < .001 for trend). The HRs of total mortality comparing extreme quintiles of specific dietary fats were 1.08 (95% CI, 1.03-1.14) for saturated fat, 0.81 (95% CI, 0.78-0.84) for polyunsaturated fatty acid (PUFA), 0.89 (95% CI, 0.84-0.94) for monounsaturated fatty acid (MUFA), and 1.13 (95% CI, 1.07-1.18) for trans-fat (P < .001 for trend for all). Replacing 5% of energy from saturated fats with equivalent energy from PUFA and MUFA was associated with estimated reductions in total mortality of 27% (HR, 0.73; 95% CI, 0.70-0.77) and 13% (HR, 0.87; 95% CI, 0.82-0.93), respectively. The HR for total mortality comparing extreme quintiles of ω-6 PUFA intake was 0.85 (95% CI, 0.81-0.89; P < .001 for trend). Intake of ω-6 PUFA, especially linoleic acid, was inversely associated with mortality owing to most major causes, whereas marine ω-3 PUFA intake was associated with a modestly lower total mortality (HR comparing extreme quintiles, 0.96; 95% CI, 0.93-1.00; P = .002 for trend).
Dietary intake of SFA, when substituted for total carbohydrates, was associated with slightly higher cancer mortality (HR comparing extreme quintiles, 1.07; 95% CI, 0.98-1.17; P = .02 for trend), whereas PUFA intake, especially linoleic acid intake, was associated with modestly lower cancer mortality (HR comparing extreme quintiles of PUFA intake, 0.93; 95% CI, 0.87-0.99;P = .02 for trend) (eTables 13 and 14 in theSupplement). Other Major subclasses of dietary fat generally were not associated with cancer mortality except that α-linolenic acid intake was associated with a slightly elevated risk for cancer mortality (eTables 13 and 14 in the Supplement). However,this association was not significant when recent α-linolenic acid intake was analyzed (eTable 7 in the Supplement). We observed inverse associations of PUFA and MUFA intakes and strong positive associations of TFA intake with neurodegenerative (eTable 15 in the Supplement) and respiratory (eTable 16 in the Supplement) disease mortality. Higher SFA intake was associated with a substantial increase of mortality due to respiratory disease (HR comparing extreme quintiles, 1.56; 95% CI, 1.30-1.87;P < .001 for trend). Among Major PUFAs, ω-3 PUFA intake, primarily α-linolenic acid,was inversely associated with neurodegenerative disease mortality (eTable 17 in the Supplement). Marine ω-3 PUFA intake was inversely associated with respiratory disease mortality (eTable 18 in the Supplement). Sensitivity analyses minimally changed these results for causespecific mortality."
If PUFAs are the scourge Ray Peat claims they are, shouldn't we expect to see people at the highest percentiles of PUFA intakes get sick more and die more than the ones with the lowest PUFA intakes?
-
There are many reasons to doubt the conclusions reached by those studies.
One of which is: Most observational diet studies use derived variables such as sfa pufa in the diet. But they derive those variables from questionnaires, with questions such as how often did you eat cheese or butter or margarine. Then they use some formula to convert that into amount of sfa or pufa. This can create a lot of noise within that data. Many people don't know the difference between butter and margarine (so someone can be guzzling on pufa margarine but in the dataset is now in the high sfa category.
Foods that regular people eat also change in time. The first study you mentioned started in the 1980s, when the same food could have different nutrients, such as additives, pufas etc.
Pufa intake can then load onto different foods, eg if there wasnt pufa added to everything, then pufa intake would just be a proxy of eating fish, nuts, seeds and vegetables. And not soybean oil. Those products are also often proxies of wealth and status. I also wonder what the people in those studies eat if they fall into the high sfa category without being a peatard, just deep fried lard or partially hydrogenated soybean oil? Being in such a category probably also correlates with other variables that correlate with bad outcomes.
If you look at studies that correlate individual foods with certain outcomes (e.g. butter vs mortality, cheese vs mortality), the effects are often null or suggesting benefit. Such studies are much closer to the real world, because people eat foods not sfa/pufa/etc.
And then there are also animal studies, etc.
-
Epidemiological studies can control for things that aren't being controlled for, or just have bad data.
Israelis have relatively high rates of heart disease despite eating one of the most PUFA-rich diets in the world. This has resulted in the coining of the "Israel Paradox."
Israel might not singularly disprove what you posted, as I don't have high insight into Israeli lifestyle habits. It's just food for thought.
" In fact, Israeli Jews may be regarded as a population-based dietary experiment of the effect of a high omega-6 PUFA diet, a diet that until recently was widely recommended. Despite such national habits, there is paradoxically a high prevalence of cardiovascular diseases, hypertension, non-insulin-dependent diabetes mellitus and obesity-all diseases that are associated with hyperinsulinemia (HI) and insulin resistance (IR), and grouped together as the insulin resistance syndrome or syndrome X. "