Testosterone worldwide
-
I have a site where I've posted a research project I did on testosterone levels worldwide, and how they vary in different situations. I was looking to answer the question "why are testosterone levels dropping." It's a work in progress and at times shill-ish (you know i will be selling ebooks soon)
The site: https://testosteronedecline.com/
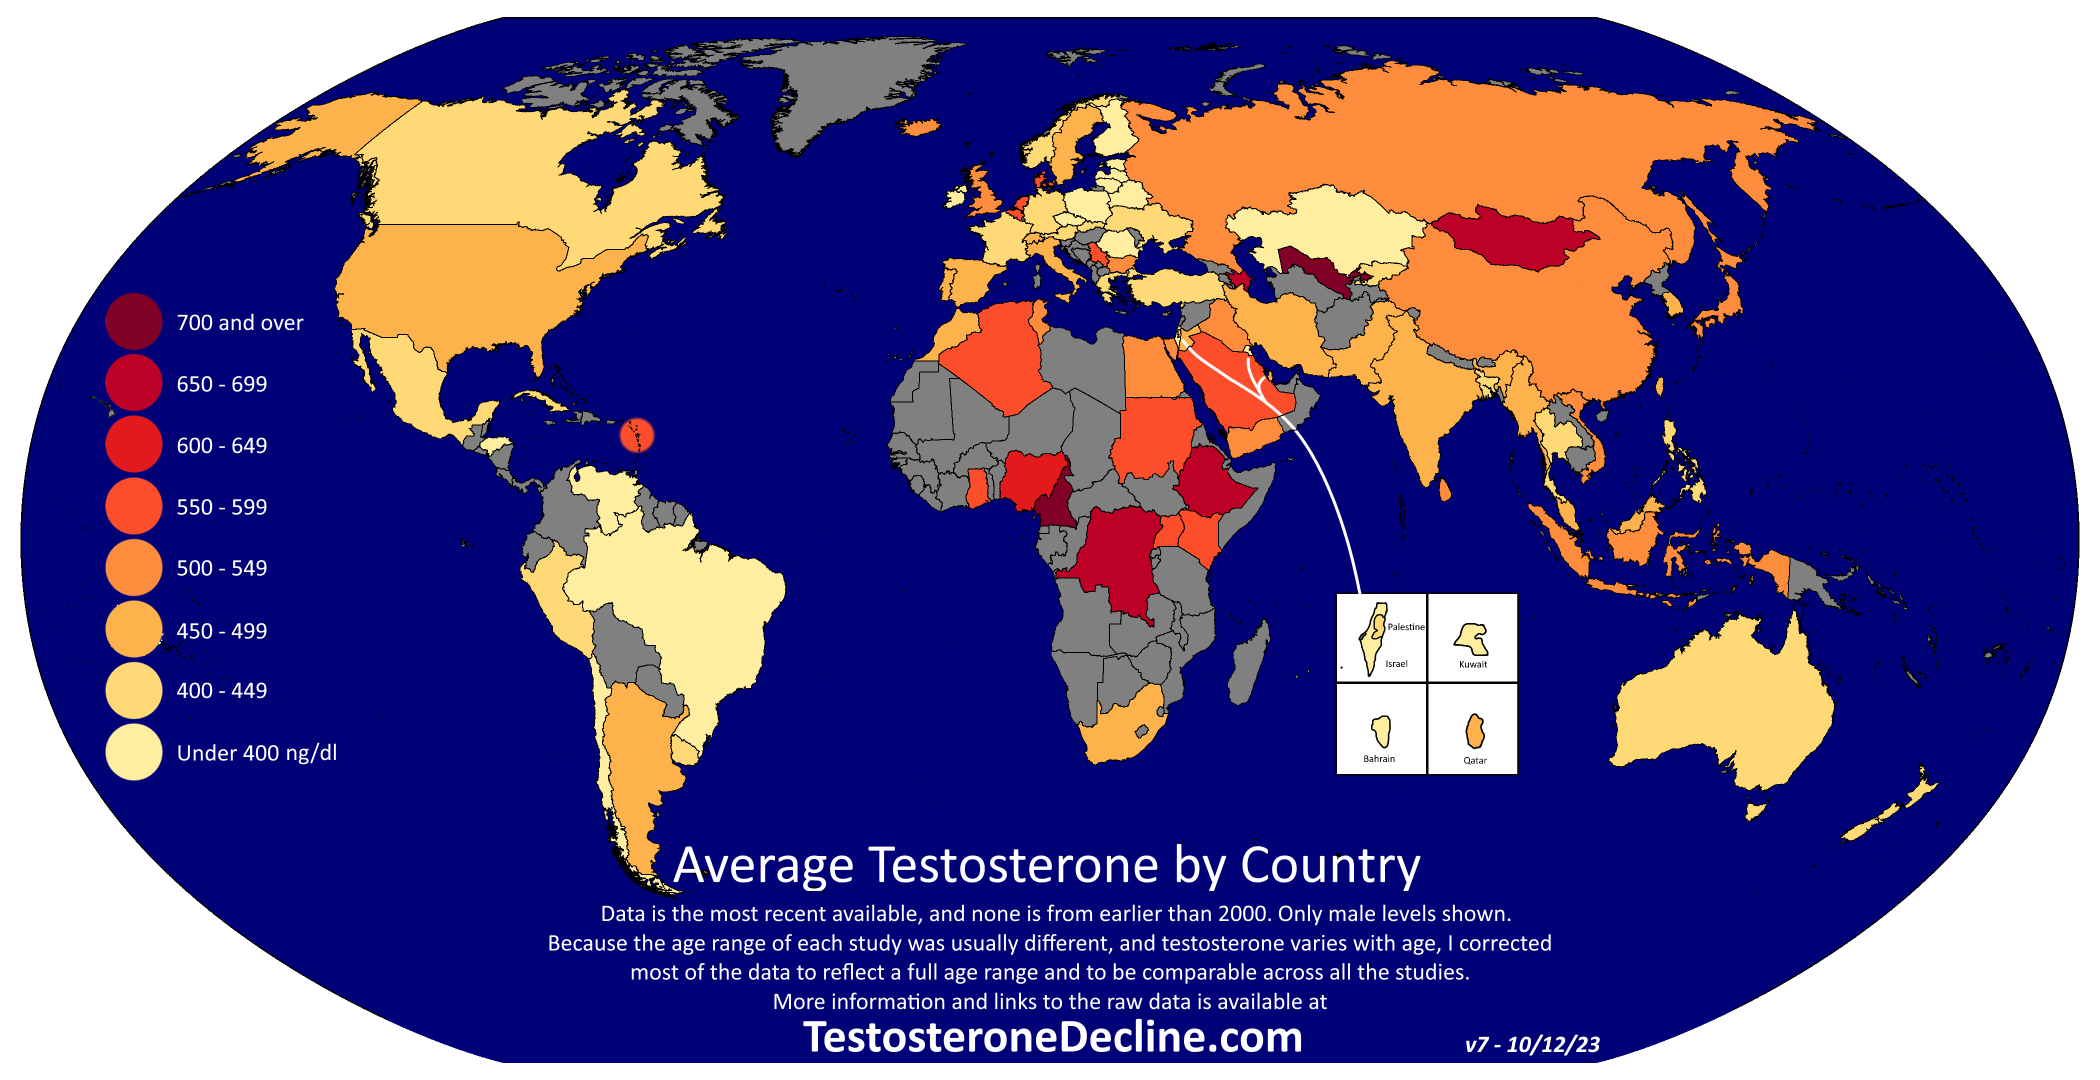
A big map of test levels: https://testosteronedecline.com/wp-content/uploads/2023/10/Testosterone-Levels-Worldwide-full-size.png
I am doing more research, and putting together more resources so I wanted to have a thread here for discussion, critiques, suggestions, etc.
There's stuff I haven't published yet, for example a similar world map of TSH levels, info on anogenital distance variation (an indication of prenatal testosterone), correlations between diet and testosterone levels in NHANES data - but I want to discuss stuff here before I publish it to the world.
-
 D donovan moved this topic from Bioenergetics Discussion on
-
@insufferable definitely interested. Moved to experimental logs category.
-
@insufferable Do you have timeseries data on TSH? Would be fascinating to see and estimate the prevalence of hypothyroidism.
-
@brad Yeah that would be awesome. I don't have enough data to do that properly at the moment, but I will probably be able to show the USA's rising TSH at least from the late 80's to today.
my current TSH spreadsheet: https://docs.google.com/spreadsheets/d/e/2PACX-1vTOE6ppgrSLoLynKe75kYphJ5rwoBgIJhLtN1W4czknpeO1-yZzAc2qCP1Wt21tl_e0ci7K0-Y4mbcC/pubhtml
current TSH map:
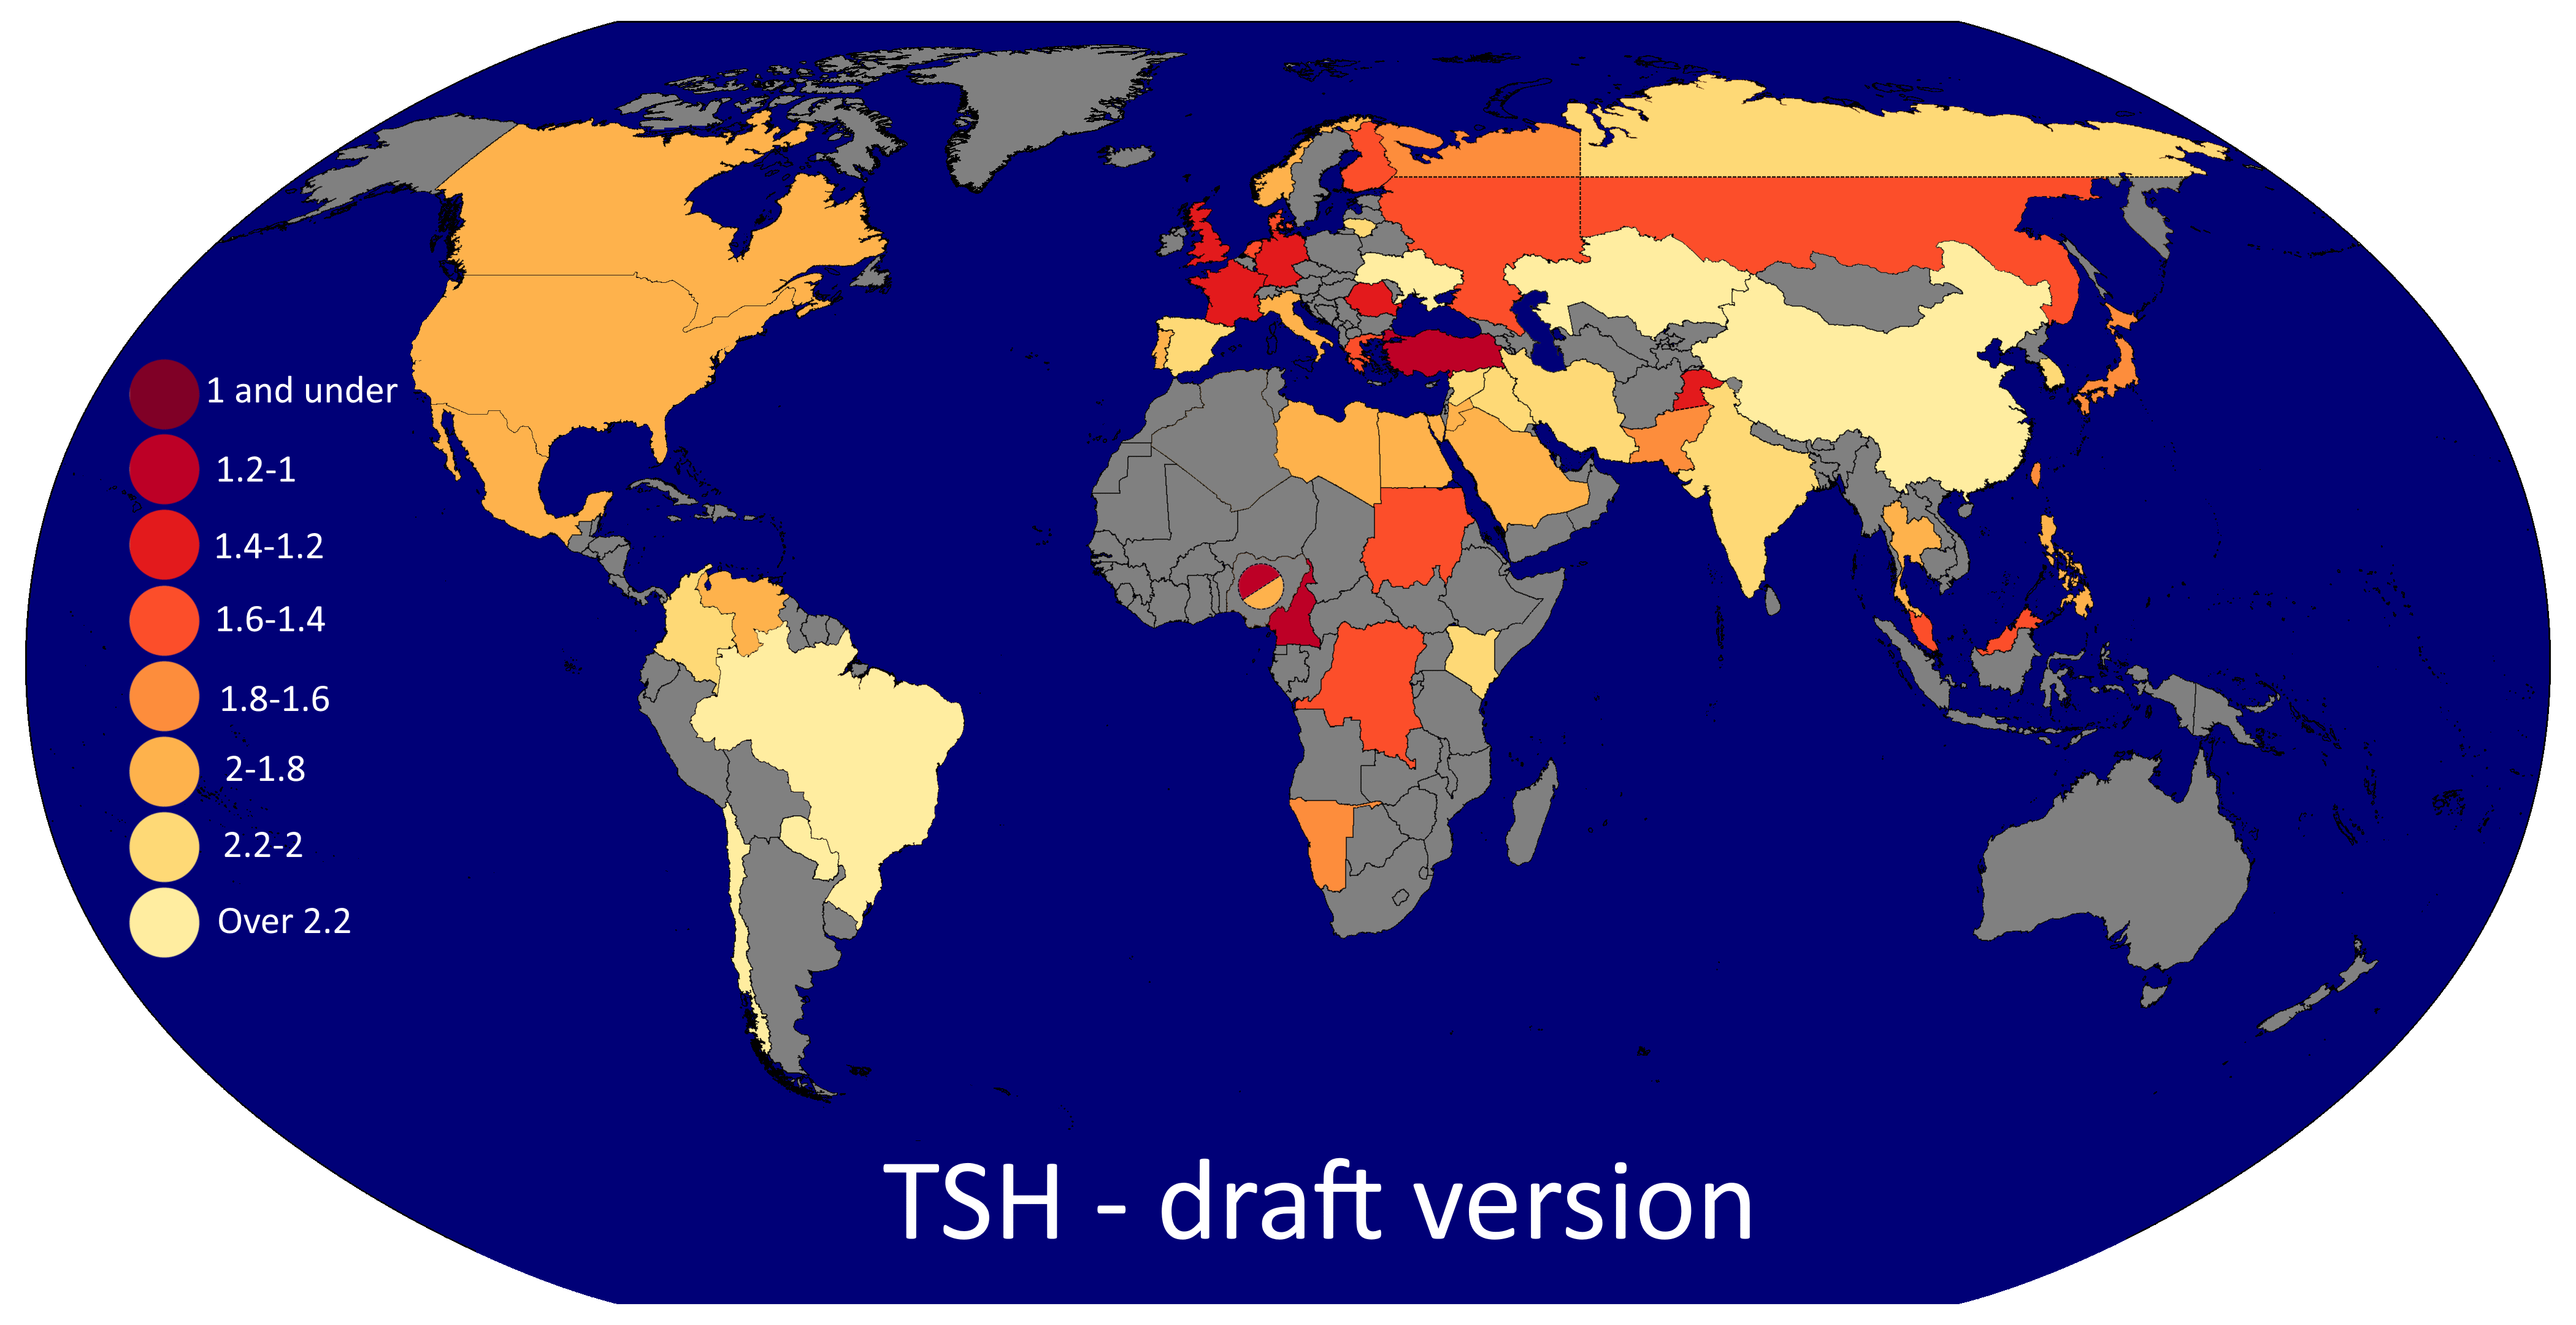
(based on single datapoints mostly, so parts of it could be totally different in reality!)First thing I notice is that a lot of it (but not all?) correlates with the testosterone map
which is unsurprising because thyroid and testosterone are strongly connected it seems
Hypothyroid brazillians went from 279 ng/dl to 715 ng/dl testosterone when given 0.2 mg T3 for a month
https://onlinelibrary.wiley.com/doi/epdf/10.1002/j.1939-4640.1988.tb01038.x -
2015-16 NHANES data, 1000+ men across the USA:

Sugar over 350g = 558 ng/dl testosterone
300-350 = 488
250-300 = 459
200-250 = 465
150-200 = 467
100-150 = 462
75-100 = 450
50-75 = 450
25-50 = 463
12.5-25 = 410
7-12.5 = 495
0-7 = 467Carbs (percent)
Over 70% = 425 ng/dl
60-70 = 470
50-60 = 464
40-50 = 457
30-40 = 449
20-30 = 471
Under 20 (only 6 guys) = 368Fat (percent)
over 50% = 441
40-50 = 446
30-40 = 460
20-30 = 472
10-20 = 452
Under 10 (only 5 guys) = 481Protein (percent)
Over 30% = 477
20-30 = 466
15-20 = 447
10-15 = 458
0-10 = 494Fiber
Over 60 (highgest is 85.4) = 495
50-60 = 516
40-50 = 443
30-40 = 446
20-30 = 480
10-20 = 456
0-10 = 448 -
@insufferable
This is all great. The maps are a first-rate idea.
-
This is great. Do they not remove people who injects testosterone from these studies? Surely people are not having 2000 naturally? Do you know the correlation between T-levels and screen time?
-
Thanks!
There were just a few guys (3 maybe) on TRT which i should remove but didnt see it before i started graphing.
I did remove 1 or 2 guys with like 4000 ng/dl which I imagine was steroids.
There were a few 1000-2000 guys who werent on TRT and i think they are just naturally high test. Hunter gatherer studies show a few guys naturally that high. Out of maybe 70 turkana pastoralists i think there were two guys around 2000 ng/dl. (if i remember correctly)
Screentime vs Test is a great idea, ill see if i can do it with NHANES.
-
My guess is that the testosterone decline is heavily prenatal in origin.
Anogenital distance (AGD) is a mammilian measurement under the control of prenatal testosterone (higher distance = more masculinized = more prenatal testosterone)
Infant AGD is high in countries with currently high testosterone in adults, and low in countries with low adult test. For example, Nigeria adult testosterone is about double Mexico adult testosterone, and Nigeria infant AGD is about double Mexico infant AGD. (don't forget that Mexico used to have high testosterone too though, and I would predict that they used to have high AGD as well. Furthermore, test in Nigeria is in fact beginning to drop now in connection with urbanization.) AGD has dropped in concert with test levels in these countries (in the few instances where I have historical AGD data)
In several areas, mostly in Asia, I saw data where the old men had the same and even higher testosterone than the young men, despite the fact that testosterone is supposed to decline with age. These old men are exposed to the same endocrine disruptors in adulthood that the young men are. But I think the old men were born BEFORE there was so much prenatal endocrine disruptor exposure. That means that for the rest of their life, their baseline of testosterone is higher: even as it falls with old age, it is still higher than the young man's, whose baseline testosterone was damaged before he was even born. There is a Danish study showing a generational effect like this. At every age from 20 to 80, the previous generation's testosterone was higher than men of the next generation at that same age. They showed that effect going back to their earliest generation, men born in the 1920's. A study on old rural men in Finland in the 70's showed very high testosterone despite their old age. (in the 700s or 800s if I remember correctly) and I saw similar very high results from old men in 1960's Australia (which now has low test), and 70's/80's Texas and New Mexico. What testosterone levels would these men have had as young men? Perhaps 900-1000, which is just what hunter-gatherers have, and what anatomical data from the past suggests as well. These men were a different breed due to less (maybe none at all) PRENATAL exposure to endocrine disruptors.
There is a Danish study that discovered the major effect on human infant AGD of one EDC (an antifungal if I remember correctly) applied to the pregnant mother at a specific highly vulnerable point of the pregnancy.
Here's a chart showing low testosterone in high pesticide use countries and high testosterone in low pesticide use countries.
https://testosteronedecline.com/wp-content/uploads/2022/03/Testosterone-vs-agricultural-chemical-use-in-various-countries.pngThere's a similar relationship with US locations but my chart of that is out of date and now inaccurate. But testosterone in the Midwest (heavy corn growing region sprayed with atrazine) used to be some of the highest in the country (high 600's) around 1990, and is now about the lowest in the country (in the 300's)
More discussion of that here, with some maps and charts: https://testosteronedecline.com/what-us-state-has-the-highest-testosterone/Studies in Latin America (which mostly has atrocious testosterone levels now, although like everywhere it didn't used to be low) show unbelievably low testosterone in pesticide exposed rural men - levels in the 200's. Same with a study on Egyptian farmers. However studies on Thai farmers don't show as big a drop, and studies in the USA on pesticide exposure typically don't show the drop to be that massive either.
I can't explain the Thais, but otherwise this lines up with the prenatal exposure story. These Latin Americans and Egyptians live right in the agricultural sprayed area and I bet it's in their food and drinking water much more, so the pregnant mother is exposed to the pesticide heavily. The fetus is highly sensitive to it, takes major damage, and so goes on to be a very low testosterone adult.
But the pesticide sprayers in the USA were not exposed to such a crazy amount of pesticide before they were born, as their mothers didn't live right among the farm fields. So even though their adult pesticide use drops their testosterone, it isn't quite as bad.
There is a confounding factor though, which is 3rd world conditions - a South African study showed a U-shaped testosterone response to living condition. Tribal testosterone was high, testosterone in favela conditions was low, and testosterone in wealthy suburbs was high again.
-
I Insr referenced this topic on
-
I Insr referenced this topic on
-
@insufferable is anyone doing this but studying DHT?
There seems to be litte interest in DHT
-
@wester130 Not that I know of. I don't remember running across very many studies measuring DHT unfortunately. Although I would predict you could dig up enough studies to get a sense of DHT levels in the US in the past compared to currently.
-
I Insr referenced this topic on
-
For the 2021-2023 NHANES data, in order to remove TRT users, I screened out those with testosterone over 600 who also had LH below reference range. Apparently TRT lowers LH and FSH to near zero. I also removed some data that was probably in error.
So average testosterone in 2021-2023 was 451 ng/dl - no major difference from 2015-2016's average of 459 ng/dl.
2021-2023:
20-24: 536
25-29: 464
30-34: 476
35-39: 4402015-2016:
20-24: 535
25-29: 556
30-34: 461
35-39: 4662011-2012
20-24: 468
25-29: 438
30-34: 435
35-39: 3922003-2004
20-24: 673
25-29: 537
30-34: 541
35-39: 589 -
I Insr referenced this topic on
Hello! It looks like you're interested in this conversation, but you don't have an account yet.
Getting fed up of having to scroll through the same posts each visit? When you register for an account, you'll always come back to exactly where you were before, and choose to be notified of new replies (either via email, or push notification). You'll also be able to save bookmarks and upvote posts to show your appreciation to other community members.
With your input, this post could be even better 💗
Register Login